Money management: playing the equity curve for Buy&Hold
In the previous post, we studied the money management idea with an adaptive algorithm, the Naive Learner (2 bins). That algorithm used the previous 200 days as a lookback period for determining what happened in the past in Up and in Down days and made a forecast according to statistics.
See the details there; for example there we explained what those different MMType values mean in this test.
That strategy (the naive learner) had some losing streaks and has some winning periods. So, it was a good candidate for the playing the equity curve method.
Playing the equity curve means that we time that strategy. It doesn’t mean that we time the market! That is very-very important observation here. Repeat. We time the strategy!
Even in a bear market, we can have a strategy that is a winning strategy. In that case, we should amplify the strategy and not stop loss it.
Playing Buy&Hold is another strategy that means we buy $1 in the Russell 2000 index in 1987 and we hold it until today. Let’s see what we achive in 23 years with or without the money management timing.
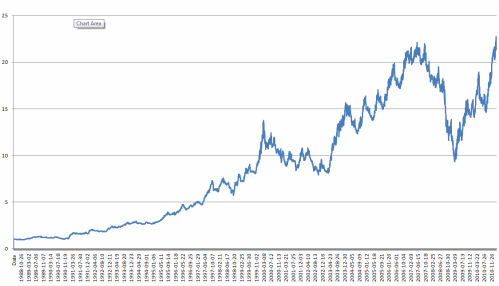
Portfolio Value charts. Starts at $1.
Buy&Hold (MMType=2, leverage = 1), without money management:

Let’s see if we have 50% reduced position under MA: (MMType=6)
MA(50):

Note how nicely the maximum loss, the DD is reduced by this technique. (Compared to the original, leverage = 1 case)
Let’s see if we have 50% reduced position under MA and 50% increased position above MA: (MMType=7)
MA(50):

Note that with about the same maxDD, the PPV increased significantly. (Compared to the original, leverage = 1 case)
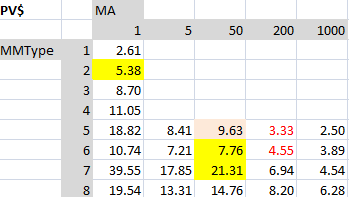
And the whole performance measurements in tables: (PV, maxDD and CAGR charts)


Some notes:
– Between the MAs, the 50 days MA is the winner.
– the MA200 and the MA1000 actually decreased the performance (albeit improved the maxDD).
The MA200 is commonly used technique by Buy&hold investors.
Note that this is not working too profitable way here (but we cannot say that it is too bad).
Using MMType=5 (playing 0 leverage under MA200), the PV is 3.33. That seems to be bad compared to the Buy&Hold’s PV of 5.38.
However, note that the maxDD is improved from -59% to -44%. So we see that the PV went worse, but the maxDD improved.
We usually can improve one thing: profit or volatility. It is very rare that we can improve both at the same time.
– if we have to use MA200, we would use the MMType=6; that is a good balance that improves maxDD, but doesn’t significantly decrease the PV (it went from 5.38 to 4.55)
– interesting that using the MMType=8 (50% increase over the MA) was worse in PV than the MMType=7 (50% decrease under MA, 50% increase above MA). This is not what we got in the previous post, in the Naive Learner case. Actually, this is what we hoped for. The MMType=7 (by decreasing leverage under MA) could improve both the PV and maxDD compared to MMType=8! That is amazing! We decreased the leverage and improved both PV and maxDD. we usually don’t expect this to happen; only hope it.
– observation on MMType=5. (0% leverage under MA; a stop loss); Based on previous post PV chart and on the current post PV chart; it is not proved to us that we should use MMType=5, and cut investment to zero under MA. In the Naive Learner case (previous post), all the PV for MMType=5 were lower than MMType=6. And the maxDD doesn’t improve significantly. This is a tradeoff, but we don’t think the additional small maxDD improvement worths that we are left out from the profit so much. Therefore, we don’t suggest MMType=5 in general.
– Using the MA(50) and if we compare it to the original (leverage=1) version, we can contend:
1. If we target the same PV=5.38 (as the original), but we want to decrease the maxDD, use MMType=6, MA(50): similar PV (=7.76, even better PV!!), but maxDD went from -59.89% to -47%
2. if we target the same maxDD=-59% (as the original), but we want more profit, use MMType=7, MA(50): similar maxDD (-57.72%), but PV went from 5.38 to 21.31 (4x times more)
Conclusion:
– Question: Does money management works not only for the Naive Learner strategy, but for the Buy&Hold strategy too?
Answer: Yes, it works very similarly as in the Naive Learner case. It works well.
– We expect that there is no general MA (either 50 or 200) that works for every strategy. We reckon that every strategy has its own optimal MA. So, it was strange to us that we find that the same MA, the MA50 seems to work best for the Naive Learner (short&long) strategy as it works best for the Buy&Hold (only long) strategy. Probably if we refine these numbers (by backtesting the MA40, MA60, MA180, etc.) we could find differences on the optimal MA, but it is interesting to observe that trends in both strategy (losing or winning trends) last for about the same 50 days. 50 trading days constitutes to about 2.5 calendar months.
– for RUT Buy&Hold, we would not suggest to use the MA200 as a guide for a general Stop Loss strategy. However, this is general among investors in real life. This test show that MA50 is better, but we haven’t optimized this parameter value. We haven’t tried other MA values. However, we reckon that other indices (SPX, Hang Seng) will have other optimal MA value. In spite of this test showed that MA50 is the best for this case, in general we tend to suggest using MA100 for Buy&Hold strategies. This will minimize whipsaws (less failed signals), and it should still give PV similar to the MA50 case. So, for a general Buy&hold strategy (long only), we would suggest using MA100 and MMType=7 (50% decrease under MA100, 50% increase above MA100). This would assure at least triple PV, with about the same maxDD as the original Buy&hold strategy. And because we switched to MA100, very few extra trades (negligible commissions and friction costs) will occur.
Filed under: Uncategorized | Leave a Comment
No Responses Yet to “Money management: playing the equity curve for Buy&Hold”